Introduction to Technical Analysis
What Is Technical Analysis?
Imagine trying to predict the future by looking into a rearview mirror. That’s kind of what technical analysis does—but in a smart, systematic way. It’s a method traders use to evaluate investments and forecast price movements by analyzing statistical trends gathered from trading activity—like price and volume.
Why Technical Analysis Matters in Trading
Think of technical analysis as your map in the wild world of markets. Without it, you’re navigating blind. Traders love it because it gives clear entry and exit points, reduces emotion-based decisions, and applies to virtually any tradable asset—from stocks and forex to crypto.
The Core Principles of Technical Analysis
Market Discounts Everything
The idea here is simple: Everything that can affect a price—earnings, news, economic data—is already reflected in the chart. So, technical analysts focus on “what” rather than “why.”
Price Moves in Trends
Prices don’t move randomly. They move in trends—up, down, or sideways. Spotting these trends early can help you ride the wave instead of wiping out.
History Repeats Itself
Because humans tend to behave the same way under similar circumstances, patterns in price charts often repeat. That’s why patterns are such a big deal in technical analysis.
Types of Technical Analysis Tools
Charts and Price Patterns
Candlestick Charts
Candlesticks are the gold standard in charting. They show opening, closing, high, and low prices in a visual format that’s easy to understand and interpret.
Line and Bar Charts
Line charts are minimalistic and good for spotting general trends. Bar charts show more detail like candlesticks but are less visually intuitive.
Technical Indicators
Leading vs Lagging Indicators
Leading indicators try to predict future price movements, while lagging indicators confirm trends after they happen. You’ll often use both in combination.
Popular Indicators
- RSI: Measures whether a stock is overbought or oversold.
- MACD: Highlights changes in momentum.
- Moving Averages: Smooth out price data to spot trends.
Key Chart Patterns Every Trader Should Know
Head and Shoulders
A bearish reversal pattern. It looks like—you guessed it—a head and two shoulders.
Double Top and Double Bottom
These classic reversal patterns signal trend exhaustion and potential reversal points.
Triangles and Flags
Continuation patterns like ascending triangles or bullish flags suggest the trend is about to resume.
Understanding Volume in Technical Analysis
What Volume Tells Us
Volume shows how much of an asset is being traded. A price move with strong volume is more trustworthy than one with weak volume.
Volume-Based Indicators
Indicators like On-Balance Volume (OBV) and Volume Oscillator help analyze volume strength and direction.
Time Frames and Their Importance
Intraday vs Swing vs Long-Term
- Intraday: Great for quick profits, but high risk.
- Swing: Ideal for traders with day jobs.
- Long-Term: Suited for investors and position traders.
Choosing the Right Time Frame
Match the time frame to your lifestyle and risk tolerance. No need to day trade if you’re working 9 to 5.
Trend Analysis
Identifying Uptrends and Downtrends
An uptrend has higher highs and higher lows. A downtrend is the opposite. Spotting these helps you follow the trend—not fight it.
Trendlines and Channels
Drawing lines on charts may seem childish, but it’s surprisingly effective. Trendlines define the slope of price moves. Channels show a path for price action.
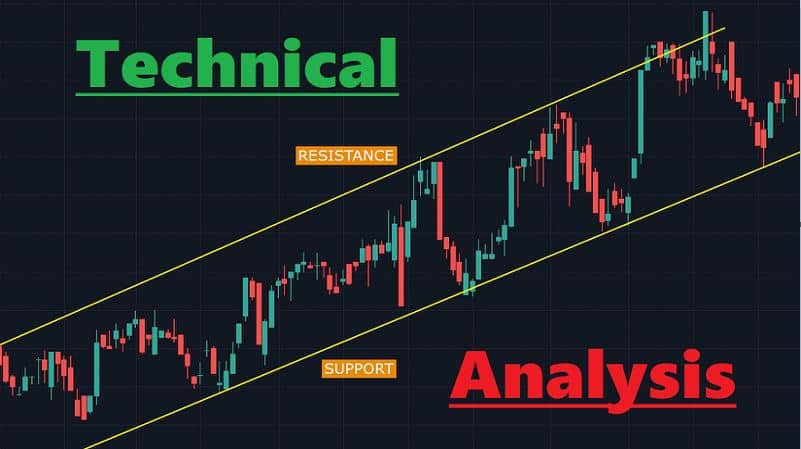
Support and Resistance Levels
How to Draw Support and Resistance
These are price levels where assets tend to pause or reverse. Support holds price from falling, resistance caps the rise.
Role in Breakouts and Reversals
Breakouts above resistance or breakdowns below support can lead to big moves—if backed by volume.
Moving Averages Explained
Simple Moving Average (SMA)
A basic average of closing prices over a period. Smooths out data for trend detection.
Exponential Moving Average (EMA)
Gives more weight to recent prices, making it more responsive to new trends.
Oscillators and Momentum Indicators
Relative Strength Index (RSI)
Measures momentum and shows overbought (>70) or oversold (<30) conditions.
MACD
Tracks momentum and trend strength. Crossovers between the MACD line and signal line give trading cues.
Fibonacci Tools
Retracements
Used to find possible support/resistance levels based on the golden ratio.
Extensions
Helps you predict where the next price wave might end.
Combining Technical Analysis with Other Methods
Technical vs Fundamental Analysis
Think of fundamental analysis as the “what” and technical analysis as the “when.” Combine them for a powerful duo.
Hybrid Approach
Smart traders often use both. Fundamentals tell you what to buy. Technicals tell you when.
Common Mistakes to Avoid in Technical Analysis
Overcomplicating Charts
Too many indicators = analysis paralysis. Keep it clean and clear.
Ignoring Risk Management
Even the best setup can fail. Always use stop-losses and control position sizes.
Building Your Own Technical Trading Strategy
Setting Entry and Exit Rules
Define clear rules. Don’t rely on gut feelings. Consistency is key.
Backtesting Your Strategy
Before going live, test your strategy on historical data to see how it holds up.
Best Tools and Platforms for Technical Analysis
Free Tools
- TradingView
- Investing.com
- Yahoo Finance
Paid Platforms
- MetaStock
- TrendSpider
- TradeStation
Conclusion
Technical analysis is like learning a new language—it might feel overwhelming at first, but once you get the hang of it, it becomes second nature. Whether you’re trading stocks, forex, or crypto, mastering technical analysis gives you a serious edge. Remember, it’s not about being right all the time—it’s about being right more than you’re wrong and managing your risk like a pro.
FAQs
1. What is the best indicator for beginners?
The Relative Strength Index (RSI) is a great starting point—simple yet powerful for identifying overbought and oversold conditions.
2. Can I rely only on technical analysis?
You can, but combining it with fundamental analysis often leads to better results, especially for long-term investing.
3. How long does it take to learn technical analysis?
With daily practice, most people get the hang of basics in 1–2 months. Mastery, however, is a continuous journey.
4. What’s better: day trading or swing trading using technical analysis?
It depends on your time commitment. Day trading is time-intensive; swing trading offers more flexibility.
5. Is technical analysis useful in crypto trading?
Absolutely! Crypto is largely sentiment-driven, making technical analysis even more relevant for spotting patterns and momentum.